

Download Easy RSI (7) 2.2.0 APK for Android right now. No extra costs. User ratings for Easy RSI (7): 0 ★"

Easy RSI (7)
Download APK
(53 MB)
Screenshot
Description
Content
The Relative Strength Index (RSI) was developed by Wells Wilder to measure the speed and change of price movements of an instrument. RSI oscillates between zero and 100. It is most commonly used to indicate temporary overbought or oversold conditions in a market. Wilder considered RSI values over 70 overbought and values below 30 oversold, but these values can be adjusted to suit particular needs and markets. For instance, 80 could be used as overbought line in a strong uptrend and 20 as oversold line in a strong downtrend.
Period used is 7. If you wish to customise the period, kindly check out the Easy Alerts+ app.
Easy Alerts+
https://play.google.com/store/apps/details?id=com.easy.alerts
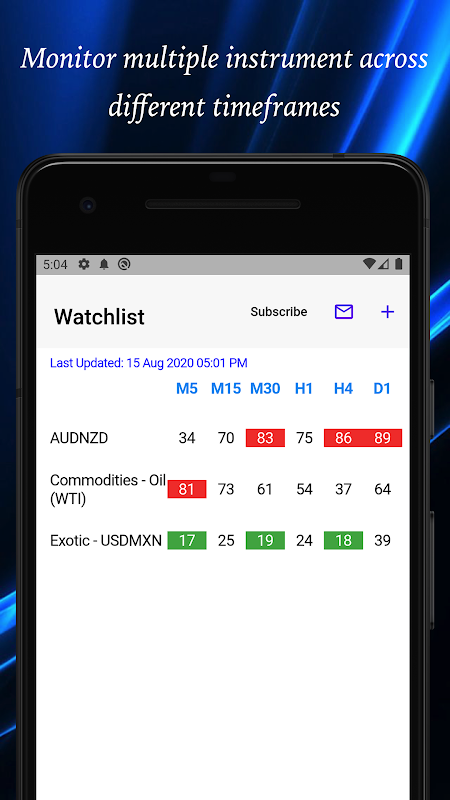
EasyRSI provides a comprehensive dashboard that allows you to view the RSI value of multiple instruments across 6 timeframes (M5, M15, M30, H1, H4, D1) at one glance. This provides you with an understanding of the current oversold/overbought conditions of the forex market on the go.
Key Features
☆ Timely display of RSI values of over 60 instruments across 6 timeframes,
☆ Allows configuration of oversold/overbought condition that best suit your personal trading strategy,
☆ Timely push notification alert when oversold or overbought condition is hit
****************
Easy Indicators relies on your support to fund its development and server costs. If you like our apps and wish to support us, kindly consider subscribing to Easy RSI Premium. This subscription removes all advertisements within the app, receive push alert based on your preferred overbought/oversold values, display M5 timeframe (available only for Deluxe subscribers) and supports our development of future enhancements.
****************
Privacy Policy:
http://easyindicators.com/privacy.html
Terms of Use:
http://easyindicators.com/terms.html
To learn more about us and our products,
please visit
http://www.easyindicators.com .
All feedback and suggestions are welcome. You can reach us via email ([email protected]) or the contact feature within the app.
Join our facebook fan page.
http://www.facebook.com/easyindicators
Follow us on Twitter (@EasyIndicators)
*** IMPORTANT NOTE ***
Please note that updates are not available during weekend.
Disclaimer/Disclosure
Forex trading on margin carries a high level of risk, and may not be suitable for all investors. The high degree of leverage can work against you as well as for you. Before deciding to trade forex, you should carefully consider your investment objectives, level of experience, and risk appetite. You must be aware of the risks of investing in forex and be willing to accept them in order to trade in these markets. Trading involves substantial risk of loss and is not suitable for all investors.
EasyIndicators has taken great measures to ensure the accuracy and timeliness of the information in the application, however, does not guarantee its accuracy and timeliness, and will not accept liability for any loss or damage, including without limitation to, any loss of profit, which may arise directly or indirectly from the use of or reliance on such information, inability to access the information, for any delay in or failure of the transmission or the receipt of any instruction or notifications sent through this application.
The Application Provider (EasyIndicators) reserves the rights to stop the service without any advance notification.
Summary:
Easy RSI (7) is a technical analysis indicator that measures the strength of a trend by comparing the average of recent gains to the average of recent losses. It is a momentum indicator that can be used to identify overbought and oversold conditions.
Calculation:
Easy RSI (7) is calculated using the following formula:
```
Easy RSI (7) = 100 - (100 / (1 + (Average of Recent Gains / Average of Recent Losses)))
```
The average of recent gains is calculated by summing the gains over the last 7 periods and dividing by 7. The average of recent losses is calculated by summing the losses over the last 7 periods and dividing by 7.
Interpretation:
Easy RSI (7) is interpreted as follows:
* Values above 70: The trend is strong and the market is considered overbought.
* Values below 30: The trend is weak and the market is considered oversold.
* Values between 30 and 70: The trend is neutral and the market is not considered overbought or oversold.
Trading Strategies:
Easy RSI (7) can be used to generate trading signals by identifying overbought and oversold conditions. Traders can use these signals to enter and exit trades.
* Buy signal: When Easy RSI (7) crosses above 30, it can be a signal to buy.
* Sell signal: When Easy RSI (7) crosses below 70, it can be a signal to sell.
Limitations:
Easy RSI (7) is a lagging indicator, which means that it can be slow to respond to changes in the market. It is also important to note that Easy RSI (7) is not a perfect indicator and it can sometimes generate false signals.
Overall:
Easy RSI (7) is a simple and easy-to-use technical analysis indicator that can be used to identify overbought and oversold conditions. It is a useful tool for traders who want to identify potential trading opportunities. However, it is important to note that Easy RSI (7) is not a perfect indicator and it should be used in conjunction with other technical analysis tools.
Information
Version
2.2.0
Release date
Aug 19 2024
File size
53 MB
Category
Tools
Requires Android
7.0+ (Nougat)
Developer
EasyIndicators
Installs
0
ID
com.easy.rsi7
Available on